Principal components analysis
In classical statistics, Principal Component Analysis (PCA) is a technique used to represent multidimensional data in a more convenient basis. The goal is to reduce dimensionality while preserving as much variance (information) as possible.
Example: Football Players' Attributes
Imagine we have a dataset consisting of the measured features, with different tests, of 100 football players:
- Speed
- Strength
- Endurance
- Reaction
- Smartness
We have a matrix of the form
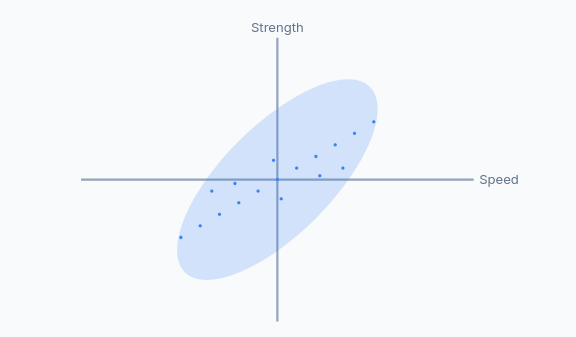
It's possible that some features are redundant. For example, speed and strength might be highly correlated — meaning they carry overlapping information. Maybe a linear combination of them can summarize both features. In such cases, we might be able to reduce the dimensionality of the dataset by combining them or even dropping one.
Covariance Matrix
To detect redundancy and correlations, we use the covariance matrix. For two variables
where
If the data is stored in the matrix
Whitening and Linear Transformation
Suppose the data is stored in a matrix
and we have
for some linear transformation
where:
is a diagonal scaling matrix, and are rotation matrices (orthogonal/unitary).
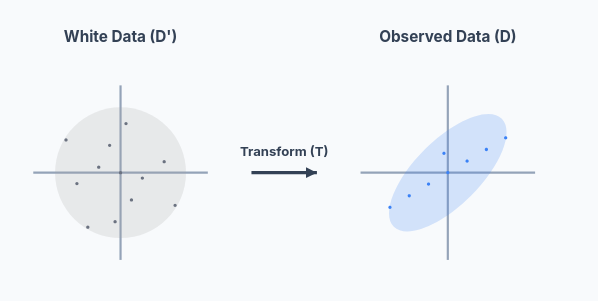
Then the covariance matrix ofbecomes:
Since
Then, the covariance matrix is always diagonalizable (this was trivial, since it is symmetric). Its eigenvectors are the columns of
This eigenvectors are linear combination of the features, that is, new features, which let us analyze the data more easily. For example, instead of strength and speed, we have "strenspeed" and "noise". The first one would have a big eigenvalue, and the second one a small one. If we undo the rotation
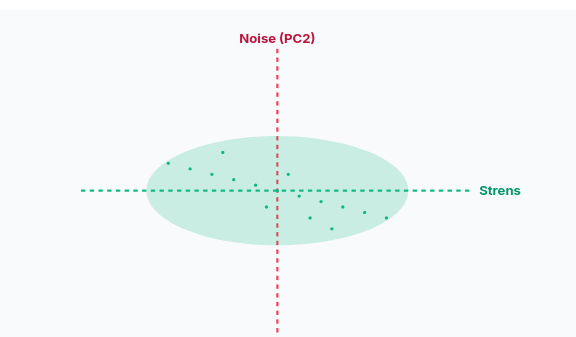
Since the "Strenspeed" axis captures most of the information, and the "Noise" axis captures very little, we can often discard the "Noise" axis without losing much important information. By doing this, we reduce the dimensionality of our dataset from 2D to 1D. Our football players are now primarily described by a single, powerful feature: their "Strenspeed". This makes analysis, visualization, and machine learning models much simpler and more efficient.